The recent Trondheim World Championships once again led to lots of discussion of Norway’s dominance of the sport, particularly on the men’s side, less so for the women. This is an evergreen data topic so I thought I’d again provide some visuals for historical context.
The data I’m working with is WC, TdS, WSC & OWG individual results stretching back to 1980. No relays! One of the tricky things about dealing with different nations across such long time periods is that political boundaries change. In what follows I’ve made two adjustments. The first I consider fairly reasonable, and frankly almost necessary: combining the Soviet athletes from the 80’s with the post-Soviet breakup Russian athletes into a single “nation”. Obviously, the USSR is not the same nation as current day Russia, but combining the two seems like a reasonable way to track “Russian” skiers over multiple decades. Just keep in mind that the 80’s numbers surely included some athletes that today would be Estonian, Kazakh or something.
The second is combining both East & West Germany from the 80’s with present day unified Germany. I don’t particularly like this one (I actually dislike it on many levels) but it doesn’t have a large impact on the overall message in the plots I’m making and it greatly simplifies some technical details of actually designing the plots.
Anyway, let’s start very simply with a plot of the number of different nations represented in the top 3, top 5 & top 10 for each season:
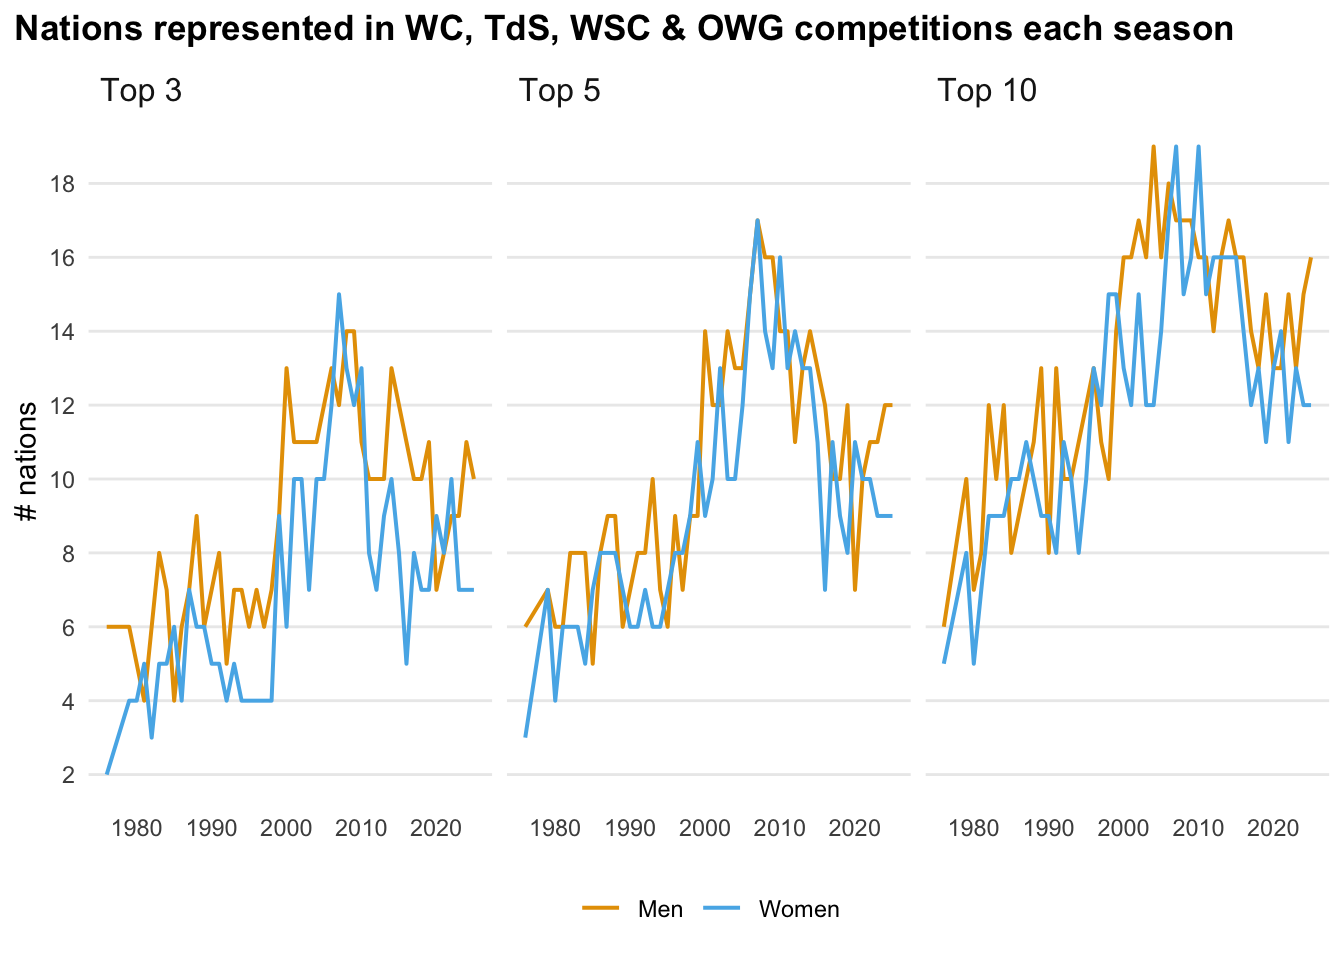
More nations until about 2010 and then it’s dropped a little since. Of course, this is very simplistic and doesn’t account for changes in the number of nations competing. The breakup of the USSR alone “increased diversity” at the top of the results simply by creating a bunch of new nations.
Instead, let’s use an actual measure of diversity (Shannon index), scaled relative to the maximum possible diversity given the number of nations competing:
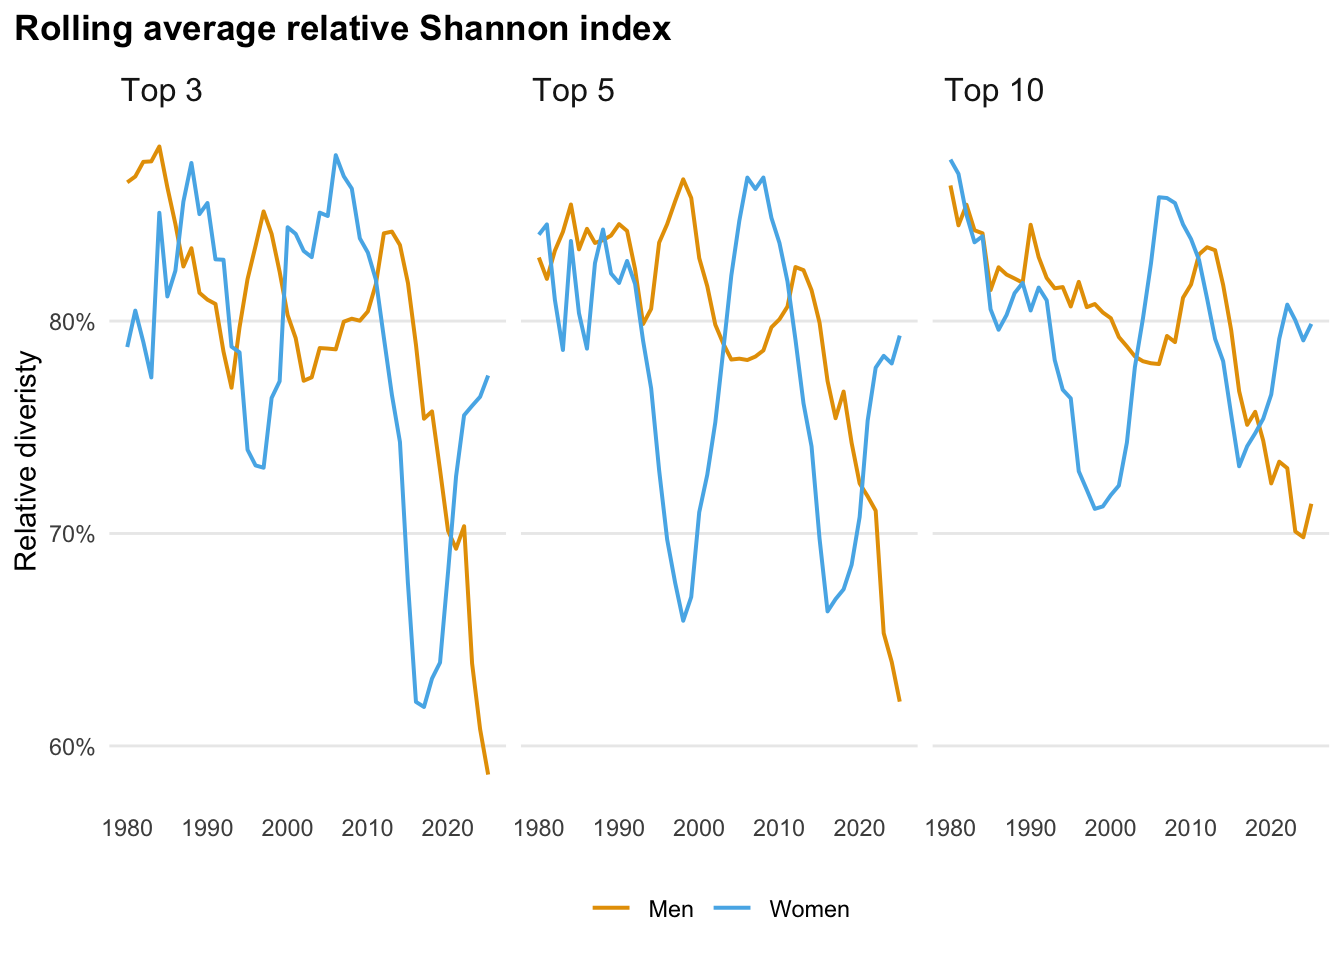
I’ve used a rolling average here to make things a little more easy to read, given the wild swings we’re seeing.
This looks much worse. Two things stand out: the wild swings in diversity in the women’s field and the precipitous drop in diversity overall in the men’s field in the last 10-15 years.
Note that the diversity drop for the men long predates Russia’s absence from the World Cup.
The fact that the wild swings for the women’s field persists in the diversity measure for the top 5 & top 10 suggests that single athlete phenomenon (e.g. Justyna Kowalczyk) are only partially responsible. Still, the late 90’s dip is probably partially due to Elena Vaelbe, and the late 10’s dip is probably Therese Johaug.
Just to round things out, let’s get a little more granular and look at the specific nations at play here:
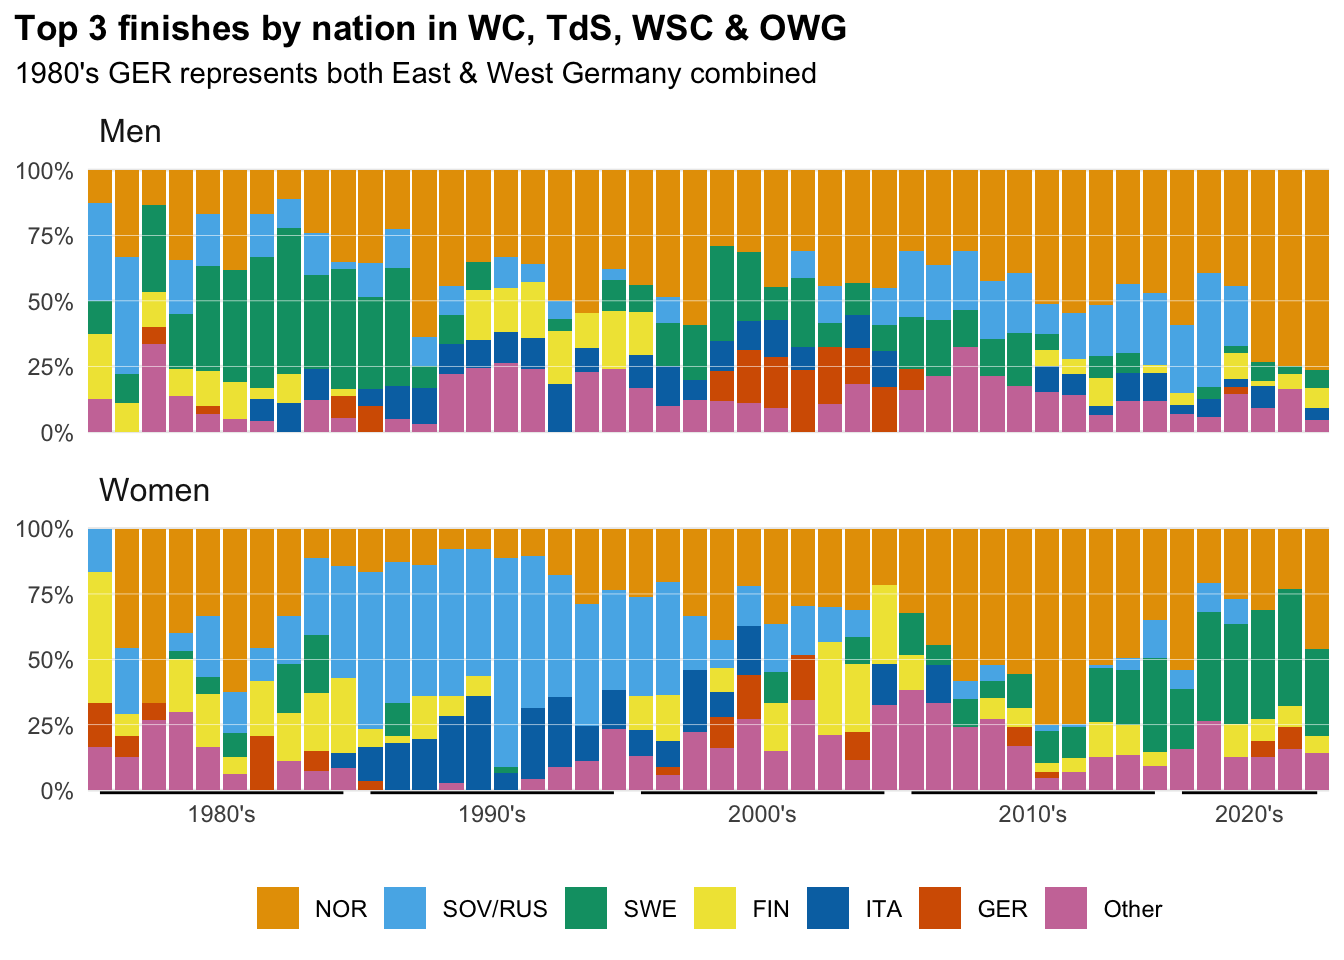
Norway has not always completely dominated the top of the sport, but I really only see two (and a half) exceptions to Norwegian dominance in this plot: the (probably artificially assisted) dominance of the Russian women in the 90’s, and the Swedish men in the late 80’s. The half an exception is the current surge of the Swedish women.
Finally, for completeness, here’s what the “Other” category looks like if we break them out and plot them on their own:
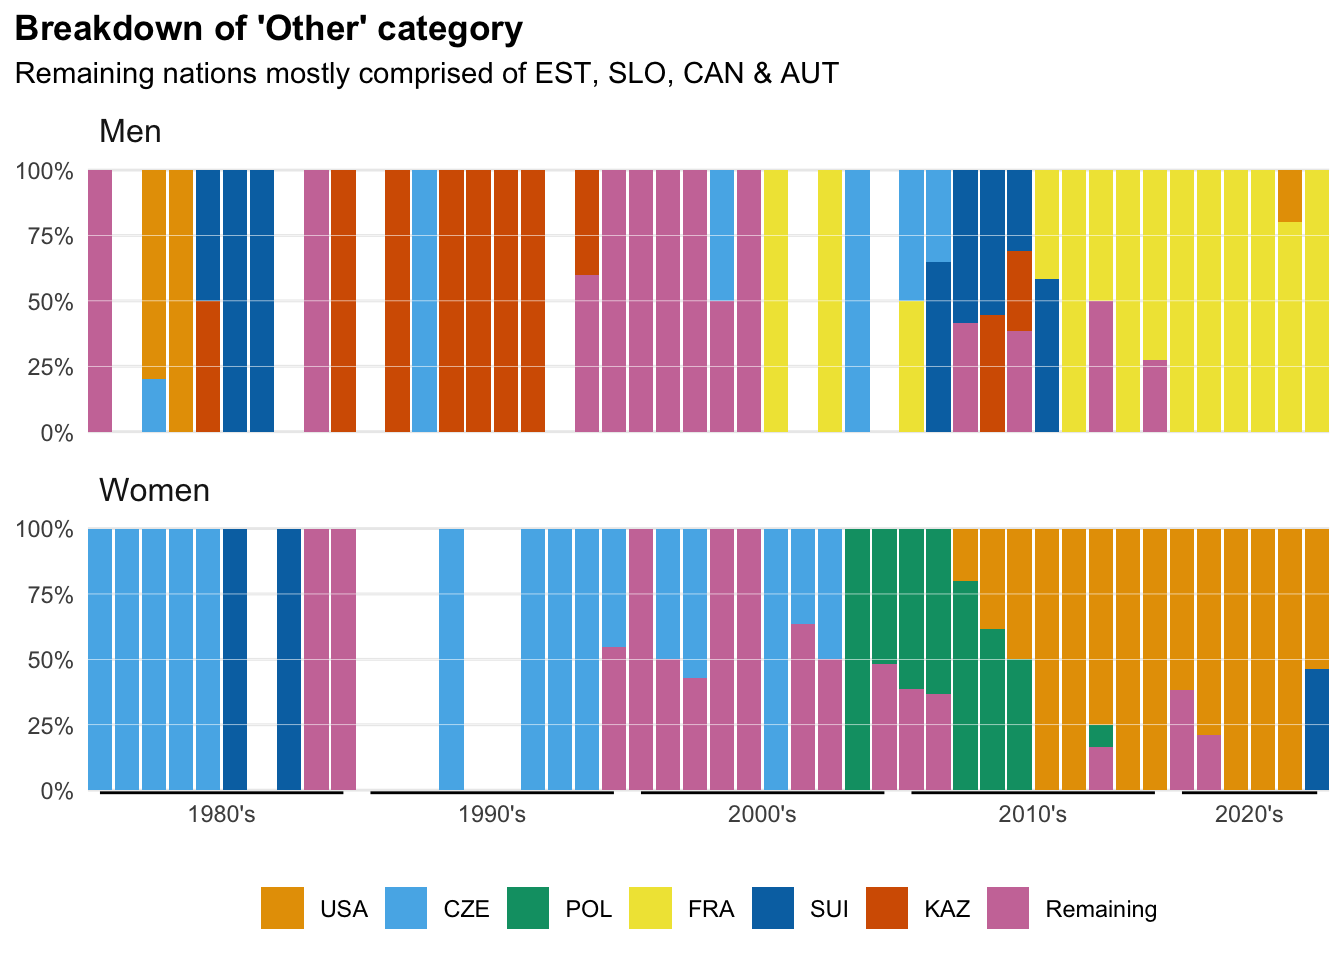
Here we can start to identify the impacts of specific individual skiers like Smirnov, Kowalczyk and Diggins.